Examples of behaviours and goals
When putting together personas there are two fairly common approaches. The behavioural approach looks at user’s motivations to act a certain way – for example being highly organised vs being poorly organised. The goal based approach looks at the underlying motivation for user actions – for example wanting to buy a product to achieve a certain goal.
Here are some potential examples from the world of eCommerce:
- Behavioural
- Hunter (knows what they want)
- Forager (has an idea of what they want)
- Explorer (just wants to see what’s available)
- Goal based
- Emma left her spare phone charger in a hotel room and needs a new one before her next trip
- Mitch needs to buy a present for a friend and knows what things they like but isn’t sure what to buy
The behavioural persona can be especially useful for determining information architecture: whether to include search, how to do categories, related products, menu structures, etc.
On the other hand the goal based persona can help us answer some deeper questions. How soon does Emma need her charger? Perhaps she needs express delivery. What is her underlying problem? Perhaps she needs a phone with a longer battery life? Does she want a branded charger? Will the brand name/logo appear on the product list? Would faceted filtering help her?
We can look even deeper with the goal based approach. Consider needing to charge while travelling – the underlying problem is that her phone has a poor battery life (or she uses it a lot). Perhaps we can include “suggested items” of a phone with a longer battery life or sell chargers in bulk to hotel chains to offer them as a service to their guests.
The number of underlying goals can be very small for niche domains or vast for things like eCommerce.
As another example where behavioural personas can offer strong insights we can consider student timetables. The behaviour of when and how often a student might check them could impact several design components:
- How they look for it (findability)
- Whether the device they are accessing it on is a matter of necessity or convenience (accessibility)
- How often they go back to it (usefulness)
- What they do with the information once they look up (utility)
Additionally there are functional considerations – classes getting cancelled, classes being temporarily moved to a different room, checking to see if they can physically make it from one class to the next to report clashes, etc.
Higher level understanding
By identifying goals you can address underlying problems or objectives. For example – why does someone look at a timetable?
In this timetable scenario the number of goals is finite and quite small. If the goal is to get to class on time then a timetable might not necessarily be the best way to achieve it. By contrast looking at the timetable for the first time the goal might be to plan their time and so a timetable would definitely be a good way to achieve it. It’s difficult to imagine too many personas with conflicting goals.
There might be peripheral considerations: such as how far they have to travel, accepting shifts at work, family obligations, hobbies & sports, joining clubs at the university that meet at certain times, etc. Knowing where and when they need to be allows them to manage their time.
So the higher level consideration is time management in general. Is looking up a timetable the best way to address this? The idea of calendar integration or push notifications might at first seem like a good addendum to timetables but neither of them necessarily address the underlying problem of planning out their time. A timetable provides a high level overview they can look at a glance. Most students only look at their timetable a few times before they memorise it.
But from a behavioural perspective we can consider other factors as well, for example:
- If they plan meticulously they might write everything down or add it to their phone calendar so that it fits in with the rest of their lives
- If they are more relaxed about university they might be more interested in labs and tutorials rather than lectures which are available online
- If they are first years or international students who are unfamiliar with how things work at university they might find the terminology confusing
There are different types of observable behaviours that can be addressed which are typically distinct from goal oriented considerations.
The article Personas are dead, long live heroes provides an interesting case for rethinking personas. In general personas are contrived and pat. Giving them names and adding a photo doesn’t make them any more real – they are archetypes not actual people. The article proposes considering personas as heroes in a story. In this way we can look at the perils and successes of their story. This lends itself well to a behavioural approach for personas compared to a goal oriented one.
Case study: Deakin University
Overview
This project was done as the UX Lead for Deakin University’s new Student Management System implementation. I undertook a process of developing both behavioural personas (through user heroes) and abstract high-level goals (through “jobs to be done”). The process involved:
- Understanding the end-to-end requirements and overall student lifecycle
- Stakeholder workshops to understand the staff perspective
- Data analysis to create audience segmentation
- Qualitative research, including interviews and observation sessions
- Synthesising a “jobs to be done” overview of the student lifecycle as a way of capturing user goals and motivations
- Putting the research together to create behavioural personas
- Creating a high level experience map of each persona across the student lifecycle
- Developing recommendations to the project based on behavioural & goal oriented insights discovered during research
A university has many systems that student’s interact with on a daily basis. The Student Management System focuses on administrative activities like enrollment and exam scheduling. In talking to students we learned that these administrative activities are minor considerations in their student experience.
The library, learning management system, student email, etc. all play a larger role in the student’s daily activities. As a result one of the most important considerations was for the whole system to be “low touch” and as automated as possible.
Student lifecycle
The student management system covers staff, student and some 3rd party interactions across the entire student lifecycle. This touches everything from application & enrollment, through to exam timetables & graduations.
The first step of this research was understanding where User Experience Architecture fits into an enterprise project of this scope. This involved reading through process maps, requirements documents and workshops with Business Analysts and stakeholders.
Most universities follow similar student lifecycle . The nuances within each area are different depending on the university, but at a high level the lifecycle looks like this:
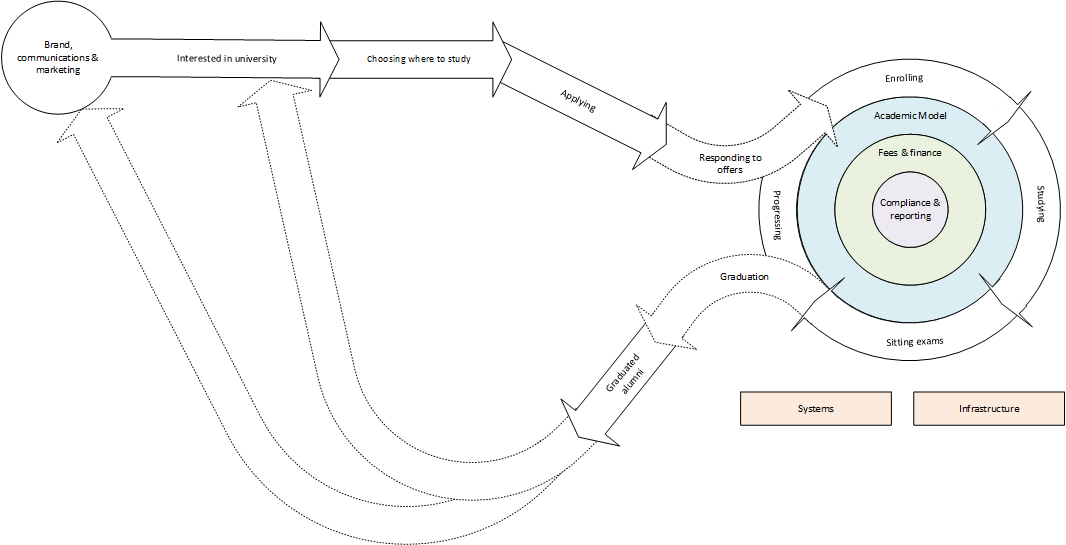
Over time I expanded that diagram into a flowchart that sits as an A0 poster on the project wall. For each area multiple systems are involved including:
- Point of origin – navigating to the student management
- Single sign-on – including security considerations
- Source of truth – for example on data about units of study
- Staff interactions – responses to queries and generating workflows
As well as systems each stage of the process involved different motivations – both motivations of the university and motivations of the student. These goals are not always aligned and need to be addressed differently. Finally there are complicating factors such as student behaviour or functional issues due to the student’s cohort.
Data analysis
I portioned a small amount of time to data mining and analysis as a precursor to qualitative research. I did data mining to extract 12 months of anonymised enrollment statistics from the database of the existing student management system. The analysis itself was done in SPSS and a full understanding requires some data science literacy.
The purpose of this data analysis was to do audience segmentation. This would allow better selection criteria of students for qualitative research. This was important because demographic and cohort factors included significant variation within the student body. The criteria analysed were:
- Age
- Gender
- Domestic or international
- Commonwealth sponsored or full fee
- Cloud or on-campus
- Campus location
- Faculty
- Number of units taken for each the last 3 trimesters
- Performance based on “Weighted Average Mark”
- The level of their degree (diploma vs doctorate)
- The number of credit points their degree required to complete
- Whether or not they were on a scholarship
- Whether they transferred credit points from previous study
It’s obvious that selecting combinations of students that meet all of these criteria is unfeasible. The problem was which criteria were the most important?
As a first step 3 principal components were extracted for graphing purposes. These principal components were some abstract combination of all the criteria that accounted for 44% of the variation between students. Next a k-means cluster was run across the 50,000+ entries across each of the above dimensions. This produced the following results:

This clustering provided minor insights but it was not possible to determine anything tangible about each of the clusters. There did seem to be a cluster of high performance students with good grades and another cluster of students taking lighter course loads – but it was not immediately apparent that this was true.
However two clusters had clear demographic representations – international students (purple) and cloud students (yellow). However this did not necessarily mean that those attributes best represented the students.
The same principal components viewed from a different angle revealed something interesting. There were two distinct clusters – students who studied at one campus (Melbourne) formed a single cluster, while students who studied at the other 3 campuses (Geelong) formed another. This can be seen this diagram:

The same components viewed from yet another angle revealed yet another thing that the clustering did not capture. This was a stratification of the data:

It was initially difficult to determine what caused this stratification. The three principal components which were graphed accounted for 44% of the variance between students. Yet the clustering across all the data did not seem to conform to the stratification of these components.
When the graph was viewed with filters for campus and faculty it became obvious what this stratification was representing:


The two groups (left and right) represent the different campuses. Diagonally, from the top of the diagram to the bottom, is a stratified representation of the four faculties.
The stratification of the principal components across faculty and campus was a telling sign of how the student body could best be clustered. Additionally, international students showed their own distinct grouping within the above stratification, showing that while their differences are best represented by faculty, international students did still group together.
This explained the vertical stratification but the question remained – was there a difference along the y-axis that would account for why the strata are so tall. The factor that best explained this variation was their course load – i.e. how many units they needed to finish to complete their degree. This is obvious once we colour code code for the course load variations:

Qualitative research
To somewhat over-simplify the data analysis we can say that 44% of demographic variance between students could be explained by three factors: campus, faculty & course load. So for example faculty was a pretty good indicator of gender (female students more likely to study arts while male students more likely to study engineering) while course load was an indicator of age (older students more likely to do masters and hence lower course loads).
When screening for participants in qualitative research we took a larger focus on those 3 factors – somewhat ignoring the others. However – stakeholder interviews did suggest international students had different functional requirements. This mirrored the initial data analysis that showed they tended to form their own cluster even though the variance between them was better explained by other factors.
First we decided to organise a set of user interviews to discuss the digital aspect of their student lifecycle. The final screening process involved making sure we chose international students, covered every faculty, focus mainly on undergraduate but making sure to have post-graduates as well, and had students from at least two campuses (the Melbourne campus and one of the Geelong campuses).
Each recorded interview was conducted by two UX consultants and observed by a Business Analyst. A total of 14 interviews were conducted. At the end each student was asked to fill out a questionnaire quantifying some of their answers.
During the interviews we discovered quite a few students had spoken to Course Advisors throughout the year for help. As additional qualitative research we observed two course advisor sessions per faculty for a total of 8 session.
Insights into user goals
The first step was to synthesise the information to understand the underlying user goals. We broke the student lifecycle down into a set of smaller activities such as “enrol into units for a trimester”, “submit assessment”, “check exam timetable”, etc.
Each activity was then extended into a set of goals. For this we used the “job stories” / “jobs to be done” model. This was inspired by the article Designing features using job stories.
For each activity we listed the goal the user had in this format: When (scenario) – I want (motivation) – so that (goal). For example: When it’s time to enrol – I want to avoid missing out – so I can continue my studies.
For each goal there was also a higher level consideration. For example: When I need to maintain my position at university, I want to have flexibility and keep it low touch, so I can focus on study and not administration.
This allows us to look at each administrative function as a solution to a problem or a way of achieving a goal. As opposed to looking at each function as standard university procedure. This doesn’t mean that we can find the ideal solution for every problem. UX is about finding the balance between solutions architecture and usability.
Additionally, we could have added scenarios to each job story that help contextualise the high level goals. These scenarios would be persona independent and use anecdotes derived from user interviews and observation sessions. This sort of approach helps to humanise a typical “user story” but does not necessarily add anything to insights. It can however be useful for heuristic based user testing by a UX consultant.
Behavioural personas
Beyond understanding user goals we also wanted a way to look upcoming designs through the lens of typical user behaviour. To achieve this we looked at behavioural personas.
For each interview and observation session we extracted specific behaviours and motivations. We additionally used insights from the data analysis component to think about students based on performance and effort.
As we re-read our notes and listened to the interview recordings I made notes about specific characteristics observed by different students. For example how much effort they expended on planning, how busy their lives were outside of school, how serious they were about their studies, etc. Some factors ended up being co-dependent, e.g. how busy they were vs how much planning they did.

Additionally we noticed that some (mostly international) students had low comprehension of the industry jargon or of how to manage their administration. This idea evolved into a persona that finds the university experience particularly bewildering – though not necessarily for language reasons.
A couple of students we spoke to mentioned “that friend” they have that knows how everything works; the one they go to for help with using the systems. We actually spoke to two of these types of students and afterwards started to think about how they became so knowledgeable. We realised that they tried to do things outside the norm and hit barriers in the systems. By having problems early and often, and having the gumption to go seek out a way to overcome them, they became highly adept at navigating the technical and administrative landscape.
The approach here was not to look at an individual interviewee and see what persona we could attach to them. Instead we looked at common behaviours among different participants. Where possible we looked at where this behaviour was backed up by the analytics data.
A traditional persona suggests attributes about an individual (gender, age, nationality, etc). There is an argument that these traditional personas are easier to identify with because they feel more realistic. As argued in the “Peronas are dead” article, this can be counter productive. Personas can feel contrived and less real precisely because they aren’t actually real people.
However the ability to identify with a “real person” in a behavioural persona was still a potential deficit. To address it we decided to make the personas surreal – by exaggerating each behaviour as though it were the trait of a superhero. Personification of individual behaviours lead us to a set of “User Heroes”. Rather than give them a realistic backstory, name and stock photo we gave each persona a superhero style name and a logo.
The biggest benefit of this was that no demographic could be attributed to an individual persona. We could see the benefit of this straight away – as project team members looked at the personas they projected their own personality and goals onto each one. Each team member was able to identify their own university experience based on the behaviours they read about.
The six “student heroes”
Super Helpful

The one that knows everything
“I’m that friend everyone has that just knows how things work”
Captain Planner

The one that plans everything
“I’d like to test the best laid plans of mice and men”
Wonder Winger

The one that’s winging it
“If you don’t have fun while you’re at uni, what’s the point?”
Excited Explorer

The one that’s confused
“I’m new to your ‘university world’ but I’ll find my way”
The Juggler

The one that does too many things
“Who says there’s not enough time to get it all done?”
The Struggler

The one that’s falling behind
“Maybe I’m just in over my head?”
Each hero was turned into a poster and stuck up on the wall. The posters come with an accompanying blurb that gives non-UX stakeholders and project members some insights into personas and into the “User Heroes” approach. A PDF that includes the full poster for each hero is available for download: Heroes.
Finally each hero was mapped across the student lifecycle. The diagram below shows the level of intensity they experience at different points in their journey. The purpose here is just to show that different behaviours will have different points of interaction. The poster for the hero joruneys is also available for download as a PDF: Hero journeys.
How to use these insights
Project recommendations from this UX research are on-going and range from high level architecture to low level design decisions. For some items the consideration is whether a particular interface is even the best approach to solving the underlying goal or problem. For other items the consideration is about how to structure the user flow and information architecture.
The same two questions continue to come up throughout solution design and development:
- How would persona X react to this?
- What is the underlying goal we are trying to achieve?
With this work we are able to evaluate an enterprise project through a user centered lens. The goal based outlook helps with deciding on the best approach to tackle a problem. The user heroes are a mechanism to evaluate every aspect of the solution design.
Additionally it allows the extended project team to get involved in improving the user experience. As an enterprise project it’s no surprise that many people identified with the “Captain Planner” hero. After seeing the broad array of personas the project team have started bringing them up during discussions. Instead of thinking about every question as “if I was a student what would I want?” it becomes about “how would different students react to this situation?”