
Planning User Interviews
Before we go into the analysis methods it’s important to spend some time looking at how to plan and run the interviews so that you can have the most effective analysis. In my last article I talked about research objectives and assumptions in UX. Having a set of research objectives is important because you want to analyse your research results in the context of these objectives.
Your discussion guide (or mod guide) for the interview should be written from your research objectives. Every question that you ask should somehow relate to a particular objective which leads to your goal (with the exception of questions that are designed to establish context or for framing).
Your mod guide should be structured into sections that relate to particular areas or themes. This typically begins with a section about the participant and then covers the various key aspects of your research. This could be sections of a user journey, key themes/concepts, or aspects of a product/service. Having this structure allows you to take notes against the appropriate section and greatly speeds up analysis.
One important consideration for early stage research is to include broad research objectives. One key value of qualitative research is your ability to discover unknowns. By combining broad research objectives with open-ended questions you can discover brand new insights that you can validate with further research.
Taking Notes and Transcripts

In a basic sense research is about capturing data. For user interviews this is qualitative data that is a record of what each participant said. There are 3 main ways of capturing data for an interview:
- Write a transcript: Write down everything that each person said (both the moderator and participant) verbatim. This generally includes “disfluencies” or “filters” such as “um”s and “ah”s as well as pauses and stutters.
- Verbatim notes: Instead of capturing everything you write down anything that the participant said that might be important but you still write it down verbatim. You generally avoid filter words or pauses unless to make a point. If you pay careful attention to what people say then you will notice that sentences often veer off course and people change what they are saying mid-way through a sentence. When you capture notes in this way you would generally start the quote from the point at which it makes most sense, leaving out the initial detour.
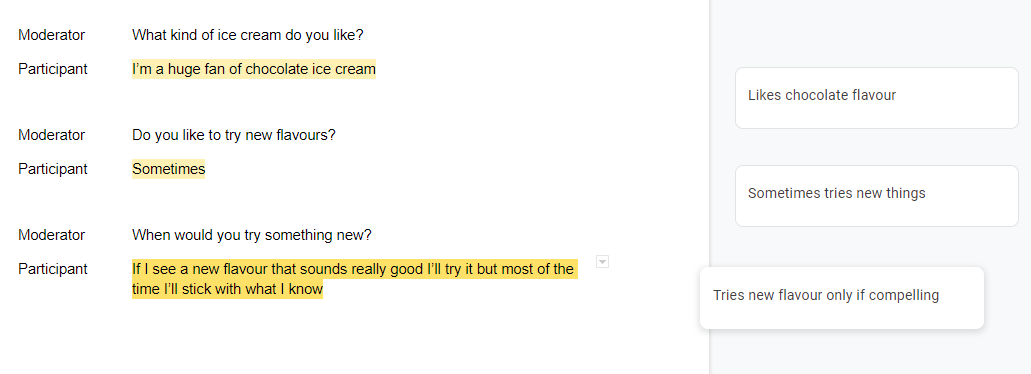
- Summary notes: In this approach you may occasionally write quotes but you will generally write a summary of what the participant said. So if a participant said “well I’m a huge fan of chocolate ice cream” you would write “likes chocolate flavour”. In this approach you are doing analysis as you go.
In an academic setting only a transcript is acceptable. For research integrity purposes you need a record of the “raw data” for your research and anything less can put your research into question. In an industry setting we often have time and budget constraints that pressure us to cut corners and follow a less rigorous approach. However a transcript is the most effective tool that you have to back-up and communicate your research findings. Transcripts also help prevent bias by making sure you capture exactly what participants said.
If a full transcript is out of the question for budget or timeline reasons then it is still strongly encouraged that you take verbatim notes. Doing an analysis in the moment as you listen to participants (or recordings) is risky because you may be misrepresenting what was actually said.
In general writing summary notes is best when the research is either rapid or informal. Examples of when it is best to take summary notes:
- You are speaking with a participant who does not want to be recorded and you are the only interviewer. This may be because they are speaking about personal things or are from a marginalised community. Having a note-taker or recording equipment could jeopardise the answers that they give. In this instance you would write your research notes as soon as the session finishes.
- The interview format is information – for example: you have been given an opportunity to speak with a relevant user last-minute and it is not possible to organise a formal session,
- If you are doing usability testing and your objective is just to find usability issues – in which case you simply note down any problems. This is especially useful in a lean UX and Agile environment where fast iteration is more important than rigorous research.
However you capture notes it’s incredibly useful if the structure of your notes matches the structure of your mod-guide. For example if you have a section about a particular stage of the user journey then you should take your notes against that section. This can pose a problem for the transcript approach because interviews may veer and participants may say jump back to a previous theme or jump ahead to something you have not discussed yet.
Ideally you would like to capture the timestamp of their statement regardless of where that statement goes in your notes structure.
Methods for analysing your research
1. Affinity Mapping
The process most familiar to the UX community is Affinity Mapping. Typically you create an Affinity Map (or Affinity Diagram) based on observations and insights. This is most often done with the summary notes approach. However it is still possible (and superior) to do Affinity Mapping on the actual statements the participants made rather than your summary. Affinity Mapping can also be combined with the other methods described in this article (particularly coding).
For the purpose of this article we will assume that you took verbatim notes or are working with a transcript.
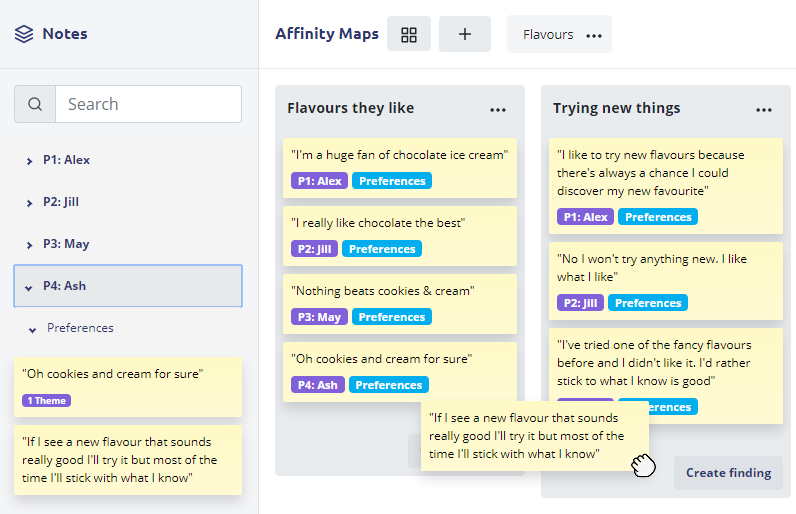
Affinity Maps are typically done physically, usually with post-it notes on a wall or table. If you took your notes on post-it notes this is fine but if your notes are digital this is more difficult. We made our research app specifically for this workflow but there are tools that you can use that work with a virtual canvas to replicate the physical experience.
To affinity map you take the statements made by each participant and you start to place them into groups or themes. For example you might have multiple participants talk about what flavour ice cream they like and you would put those into a group you would then label “flavours”. Groups should develop organically based on what common themes emerge between participants but it is also fine to have themes that affect only a single participant.
You can set-up themes in advance based on your research objectives or you can wait to see what themes emerge and look at how they address (or fail to address) your research objectives.
The biggest challenge with Affinity Mapping is that it starts incredibly unstructured and patterns emerge over time. This can make the process feel messy and less rigorous. A big limitation we found were the tools and technology used for making Affinity Maps and how difficult it was to keep track of everything (e.g. what participant said what). An especially big problem with most tools is how you manage statements that belong in more than one theme at a time.
2. Coding
Coding is the process of replacing participants statements with Codes. Note that the original transcript remains intact and that the Codes are an overlay on top of the transcript itself.
For example, one participant might have said “I’m a huge fan of chocolate ice cream” and another could have said “I really like chocolate the best” you could code both of those as “likes chocolate”. In this way you are standardising your participant responses.
Codes should generally be linked to a research objective. For example you might have an objective to understand how someone’s ice cream flavour preferences affect their purchase patterns. In this case you would link that code to that particular objective.
You can then look at the coded responses to see how they address your objectives. Here is where Affinity Mapping can be used as an analysis tool on the coded responses.
The biggest challenge with Coding is coming up with the Codes over the course of your analysis. Suppose you have 10 participants and at participant #4 you identify a new Code that would have applied to previous statements from participants. This means going back to the previous transcripts, finding the right statements, and adding the codes. This means that you may have to do multiple passes over your transcripts to capture everything properly. Ultimately you often still need a technique like Affinity Mapping on top of the Coding anyway.
3. Tagging
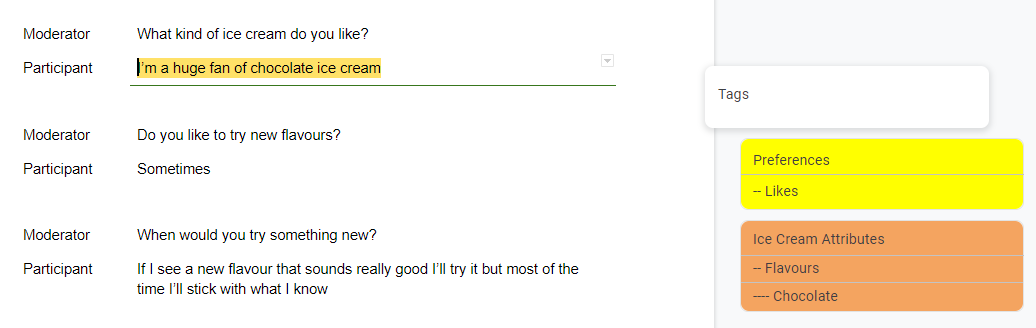
With this method you would select relevant parts of a transcript and give that part of the text an appropriate Tag. The key difference between Tagging and Coding is that Tags are typically more general than Codes and will often overlap.
For example when the participant says “I’m a huge fan of chocolate ice cream” you might tag that as “Likes” or “Preferences”. You would then also tag it as being about “Chocolate”. Here Chocolate would form part of a hierarchy: Ice Cream Attributes > Flavours > Chocolate.
For this approach you would then use the Tags as filters over the data. So for example you might look at statements to do with preferences and flavours. Or you might filter to participants that liked chocolate and cross-reference with some other Tags.
The biggest challenges with Tagging are that most people find the process incredibly tedious and that unlike Affinity Mapping it is not visual. You need to spot patterns by overlaying filters on your data or by looking through all of the tagged comments one at a time.
4. Hypothesis driven analysis
In my last article I was incredibly critical of research hypothesis in UX. While those criticisms stand this is still a methodology used in UX research and is worth covering. It’s important to keep in mind the assumptions that are necessary for you to prove or disprove a hypothesis.
For example, when we were building our UX research app we had a section where users could add their research participants. In an early version we had a button with text. However to take up less space with UI we changed the text to a plus (+) icon next to the heading. Our hypothesis was that this design pattern would be familiar from other apps (including design software) and so users would know what to do with the button. Over the course of 10 user tests every participant was able to find and use the button without a label. If even 1 or 2 participants had a serious issue we would have reconsidered our approach.
In this sense research hypothesis are better suited to user testing than to user interviews but even then they can be problematic (for the reasons outlined in my previous article). If you do take this approach the analysis is reasonably simplified.
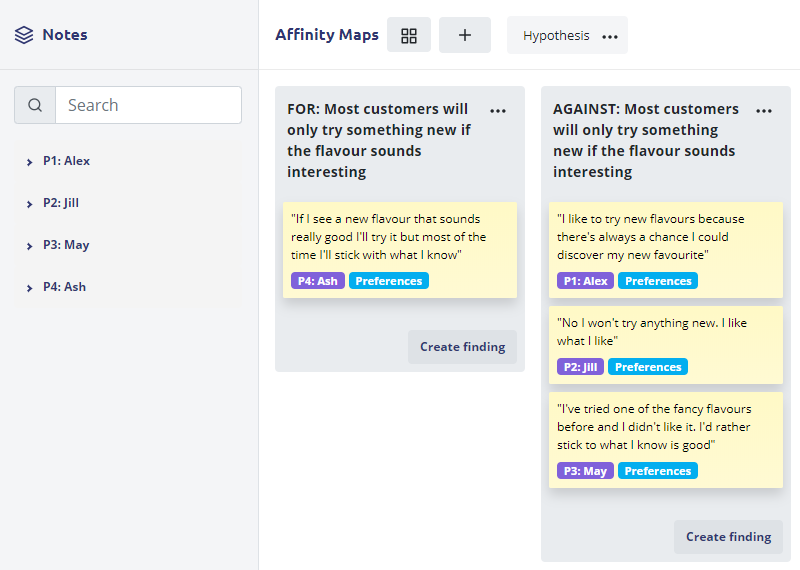
In this approach you look at every note you’ve captured (or statement in your transcript) and you think about whether it addresses one of your research hypothesis. If it does you simply mark it as evidence and move on to the next statement.
This method is quick and can be combined with any of the previous methods. For example you could Code the transcript and then make an Affinity Map with all of the research hypothesis laid out and simply put your coded statements into the appropriate hypothesis.
Thoughts on the best approach for UX
These insights have come from doing UX research into UX research as part of building a UX research tool. As part of that process we spent a lot of time thinking about what research analysis methods were best for UX. Affinity Mapping is the method that I would choose over any other.
In UX we generally don’t look for academic rigour, we have small sample sizes, we usually do more than one round of research, and we iterate frequently on our solutions. With all of these things in mind a methodology that require meticulous cataloguing of qualitative research is more likely to slow us down and prevent us from following up with more research.
That is not to say that rigour is unimportant – just that the level of rigour varies depending on your needs. The most important thing to consider when analysing user interviews is traceability. It should be possible to take any research finding and point to the evidence for why that conclusion was drawn. In an academic setting the evidence threshold is higher and should also involve an explanation of why an alternative conclusion was not drawn. In the practical world of UX simply having the relevant verbatims should be sufficient.